This is the second instalment of our deep dive into the world of AB testing. To read more, you can find Part 1 here.
By following proven testing processes, we can avoid wasting time on A/B tests that don’t serve up actionable results. In this section, I’ll share the process that works well for us.
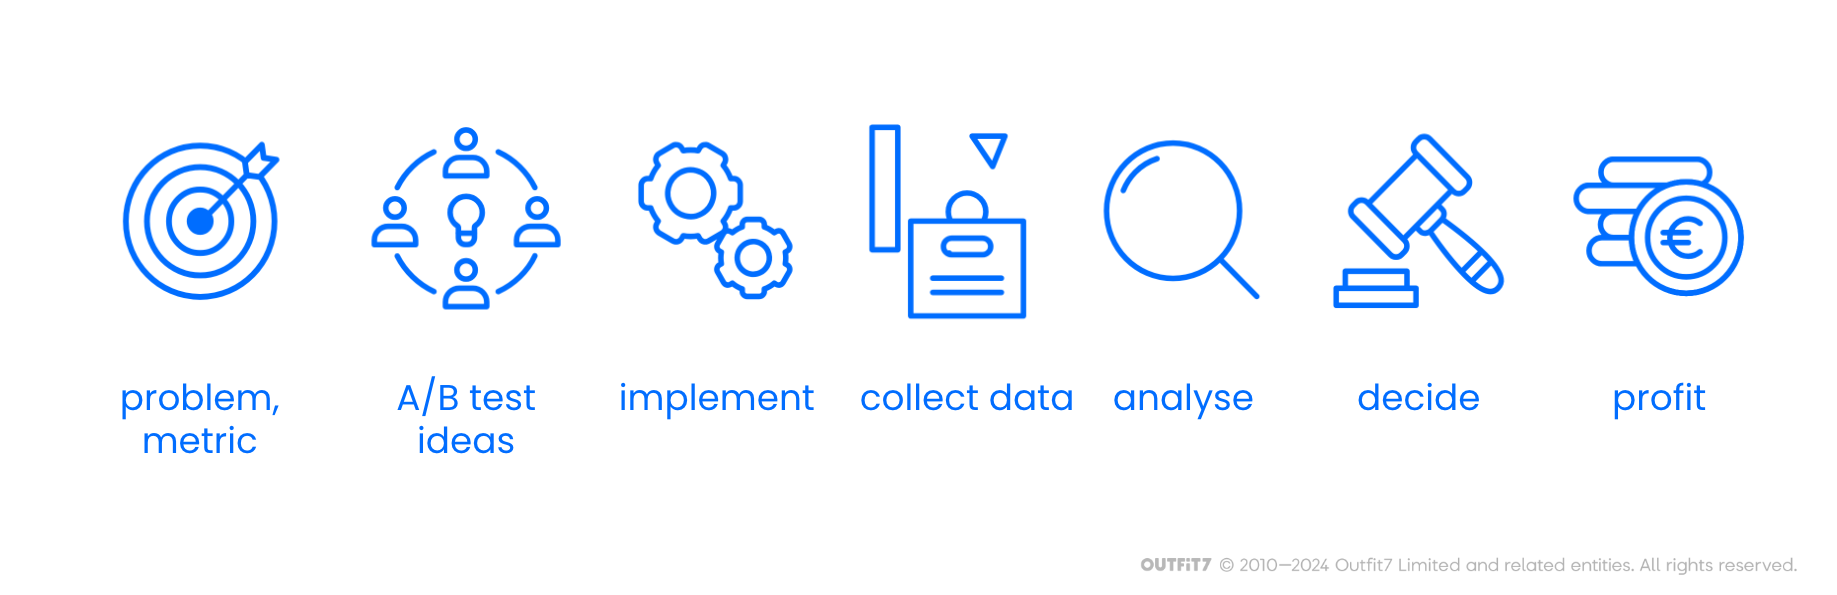
The first step in the process is to identify the problem that we want to solve, along with an associated metric that we would like to improve. Next, we generate ideas that address the problem, selecting the most promising one. Then, we implement it as an A/B test and start collecting data. When enough data is collected, we analyze it and prepare our test report. Finally, decisions are made based on the results of the A/B test. If the test confirms that the new version of the product outperforms the current one, we switch to the new one. Otherwise, we go back to one of the previous steps.
Identifying problems
Starting with a clear problem increases the chances of ending up with useful results that will help us make good decisions.
The problem might be related to business (e.g. the number of users is too low to cover the development costs), product (e.g. user interface or product features are missing or poorly designed), or monetisation (e.g. users do not make repeated purchases).
Problems can be identified by various people in the team. In our case, they’re most often flagged by the product team that designs games and new game features, or by the analytics team that regularly checks the performance of games and features. Business problems are often detected by the controlling team, technical problems by the development and quality assurance teams, and some other problems are reported by users themselves.
A problem must be translated into a metric that will indicate whether the new version of the product fixed the problem or not. We can measure things like revenue by sources, the number of daily or weekly active users, lifetime value of a user, crash rate, user retention, daily time spent playing the game, share of users that make the first and repeated in-app purchases, etc. Oftentimes, more than one metric is observed. For instance, a goal might be to decrease the prices while increasing the number of paying users, so that the total revenue increases or remains stable. Some things cannot be measured directly, in which case a proxy measure needs to be used instead.
As you begin conducting regular A/B tests, people will naturally start suggesting possible new tests. Always remember to take a step back before rushing into testing. Consider which problem the proposed test is trying to solve. Establish whether this is the real problem or whether there is actually a bigger issue or underlying problem that needs to be solved first. From there, you can start considering the best approach to fixing the problem. By taking the time to consider the issue from all angles, you may come up with an alternative solution, or one that will solve a bigger problem, be cheaper to execute, or provide more useful data.
Generating and evaluating test ideas
How you generate A/B test ideas depends on the problem you are trying to solve. Often, it’s beneficial to brainstorm with an interdisciplinary team in order to consider different aspects of the problem and potential solutions and to generate diverse ideas. Rough ideas can then be refined or adjusted depending on goals and available resources (time, budget, acceptable risk level).
In order to decide which A/B test should be done, it’s important to consider several factors: How big is the expected impact on top business objectives? Will the difference between the test and control groups be measurable with the available number of users? What will the total cost of the test be? Is there enough time to execute the test and make a final decision?
Impact
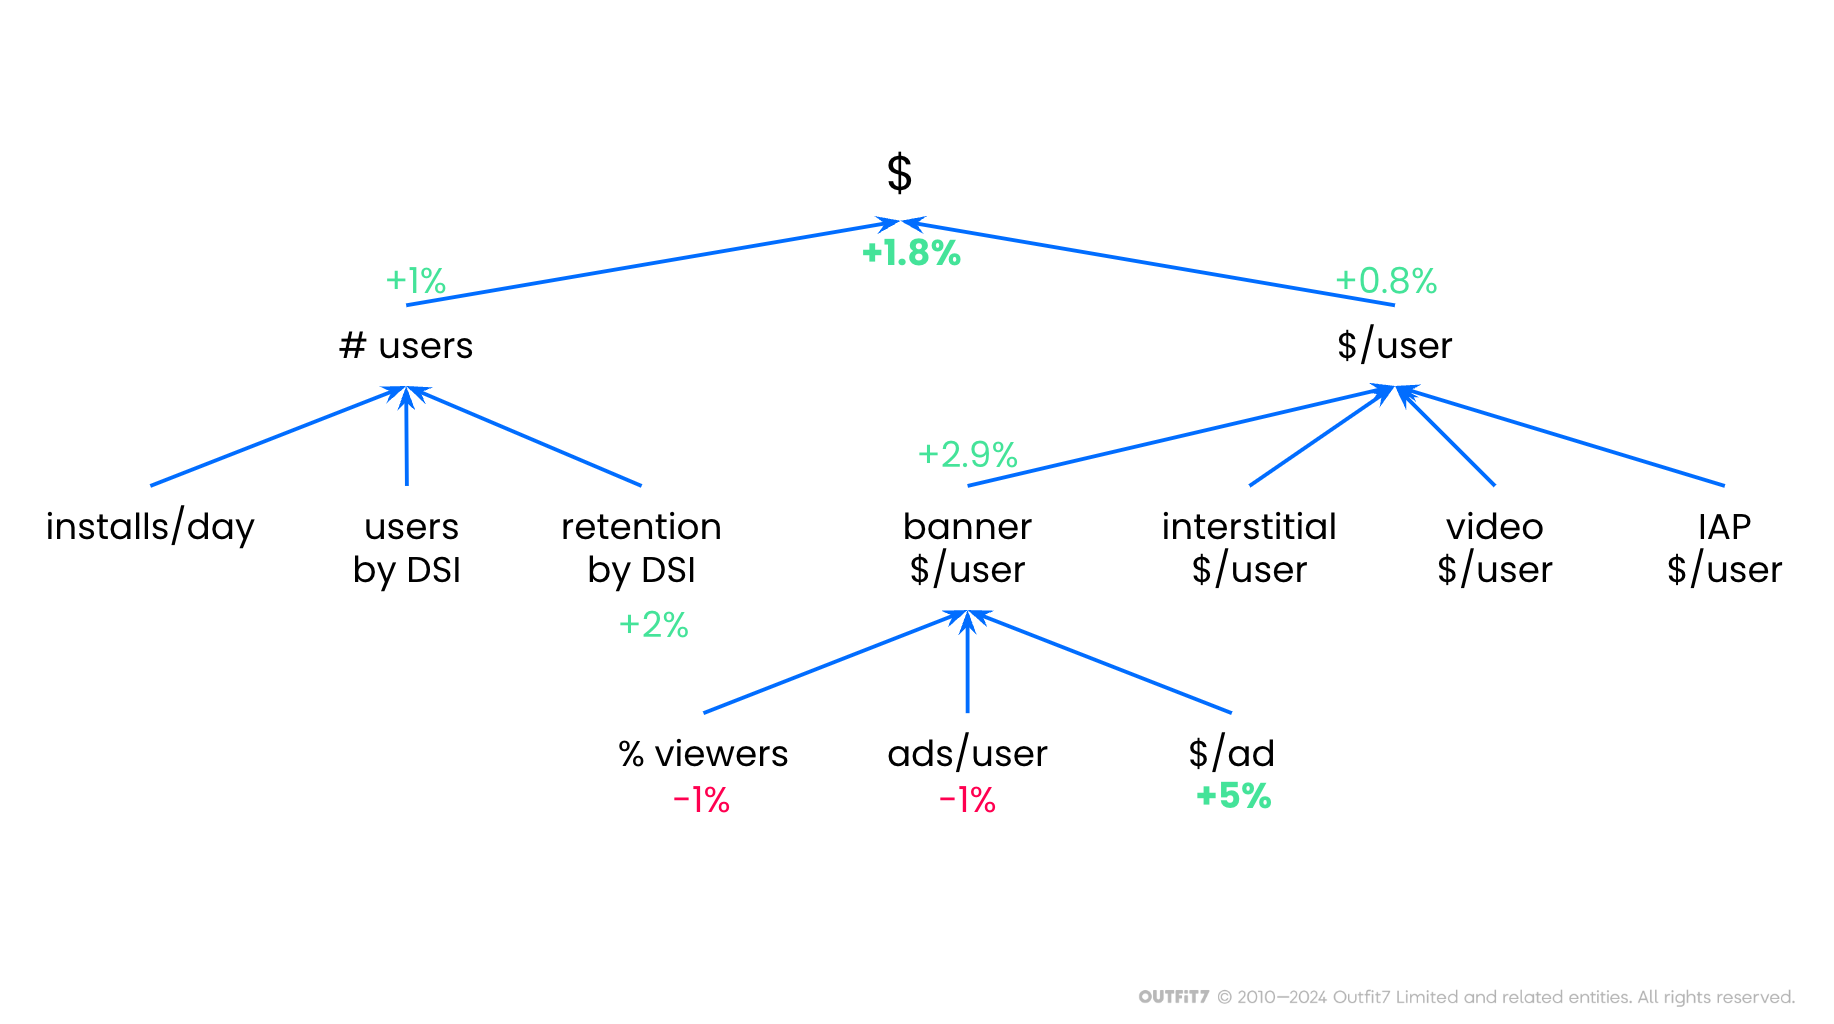
Estimating the expected impact of your A/B test will allow you to compare the value of investing in the test versus investing in other opportunities. At Outfit7, we use a key performance indicators (KPI) tree to get reliable estimates. KPI trees visually illustrate the relationship between high-level and lower-level KPIs. For example, we can compute the daily revenue of a game (the root of our KPI tree) by multiplying the number of daily active users (left branch) with the average daily revenue per user (right branch). Each KPI can be further broken down into lower-level KPIs as needed. It can be challenging to estimate the impact of a product change on total revenue, for example, so we instead estimate the impact on lower-level KPIs and cascade those estimations up the KPI tree.
Consider an A/B test where we decide not to display an in-game banner ad if the advertiser's offer falls below a minimum acceptable price threshold. A monetization expert predicts that this action could raise the average banner ad price by 5%. However, the overall revenue increase would be less. By rejecting low-price banner ads, the number of ads shown daily would decrease, resulting in a projected increase of only 2.9% in daily banner ad revenue per user. It's worth noting that banner ads are just one revenue stream, alongside interstitials, video ads, and in-app purchases, which remain unaffected by the test. Consequently, the daily revenue per user would only rise by 0.8%. Conversely, showing fewer ads might boost user retention and thus the daily active user count. Taking these factors into account, the anticipated total revenue increase from the test is estimated to be around 1.8%.KPI tree example: rejecting cheap banner ads affects several KPIs.
But is it worth investing in an A/B test with such potential? It does not depend only on the relative difference but also on the absolute values. For example, if the total daily revenue is $1000, we expect an additional $18 profit per day, or $6,400 per year. The additional revenue would cover the cost of roughly one employee for one month of work, so it does not make sense to do the test if implementing, running, and analyzing it will require more than one month of work. On the other hand, if daily revenue is $100,000, we are potentially looking at an additional $1,800 per day, which will easily cover the cost of the test in just a short period of time.
Test power
If an A/B test idea has potential for Outfit7, we proceed first by estimating whether we’ll actually be able to measure the difference between the test groups. We do this by calculating the power of the statistical test that will be used to compare variants. The power depends on three things: how big the impact of variant B is on the observed metric, how big the differences between individual users are, and how many test users we will have.
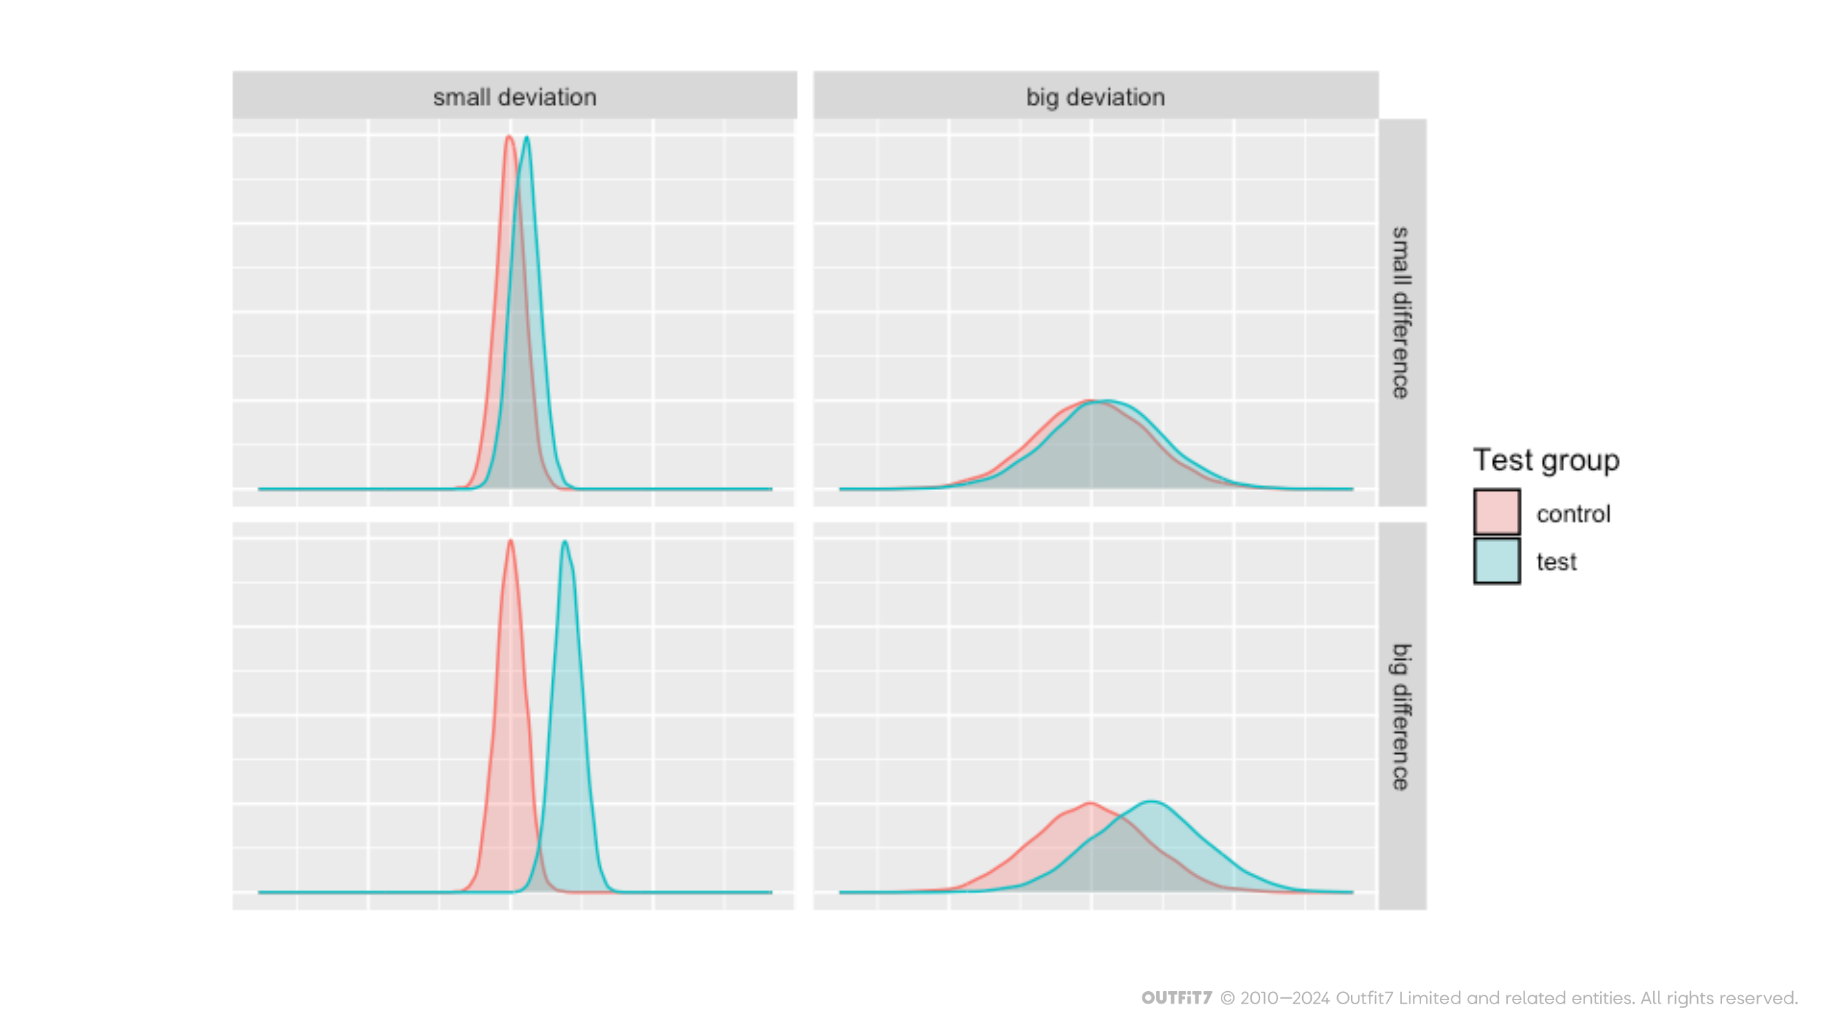
Let’s assume that the goal of a test is to improve daily play time. It would be easy to detect the difference between test groups if all users had daily play time in a narrow range (e.g. 20 and 23 minutes), group B increased their average daily play time by a significant amount (e.g. from 22 to 32 minutes) and the number of test users was high (e.g. 1M per test group). On the other hand, it would be difficult to detect the difference if daily play times were evenly distributed over a wide range (e.g. 2 to 60 minutes), the increase in group B was small (e.g. from 23 to 23.1 minutes) and we only had a small group of test users (e.g. 30 per group).
Take a look at the overlaps in the distribution of measurements in the two test groups shown below. With a big overlap, it becomes hard to detect the difference, (i.e. you will need a lot of test users to get a statistically significant result).
Still, we only have some control over two out of the three parameters. We can change the difference between the two groups by making the tested variant more extreme (e.g. increasing the amount of rewards by 200% instead of 10%). A/B tests like this are useful because they measure the maximal impact of a parameter on the performance of the product. Tests with more realistic variants include a test group with acceptable change and an alternative group with a bit bigger (but not extreme) change, or an equally big change in the opposite direction.
We can also control the number of test users. If the expected difference between test groups will be hard to detect, we must increase the number of test users. However, the required number of test users often gets far beyond the number of users that can actually be recruited for the test.
Therefore, you should always use a test power calculator to estimate the number of required test users before you start implementing an A/B test. It’s not worth running underpowered tests (tests with too few test users) because you will end up with inconclusive results.
Cost
The third check we do before running an A/B test is cost estimation. On top of the obvious costs of developing a new version of the product, data collection, cleaning and analysis, and test-user acquisition there are also hidden costs.
The first one is the opportunity cost. Regardless of your test results, some of the participants will inevitably be using an inferior version of your product during the test, resulting in worse user experience and decreased monetization.
The second hidden cost is the potential negative impact on test users, the entire user community, or even your brand as a whole. For example, our increased app size test described above had a significant negative impact on the game revenue. We decreased the number of new players and lost a lot of existing players during that test. We were aware of the risk before the test, therefore we limited it to an appropriate market segment and monitored its impact in order to stop the test as soon as the results were clear.
There may also be some hidden costs associated with cleaning up after a test. Namely, what do you do with the users from the test groups that did not win? If it’s easy to switch them to the winning group, there might be almost no cost. In mobile gaming, for example, it’s often just a matter of changing a configuration parameter and pushing it to client devices. However, sometimes it’s hard – or even impossible – to switch the users to the winning group. In this case, you have to bear the cost of some users having an inferior version of the product (that you may need to keep supporting) until the end of its lifetime.
Time needed
The final consideration is whether you can have the results of the test before the related decision needs to be taken. Even with all our A/B test infrastructure and experience, I’ve never seen a test go from concept to outcome in under two weeks, and I saw plenty that took over half a year.
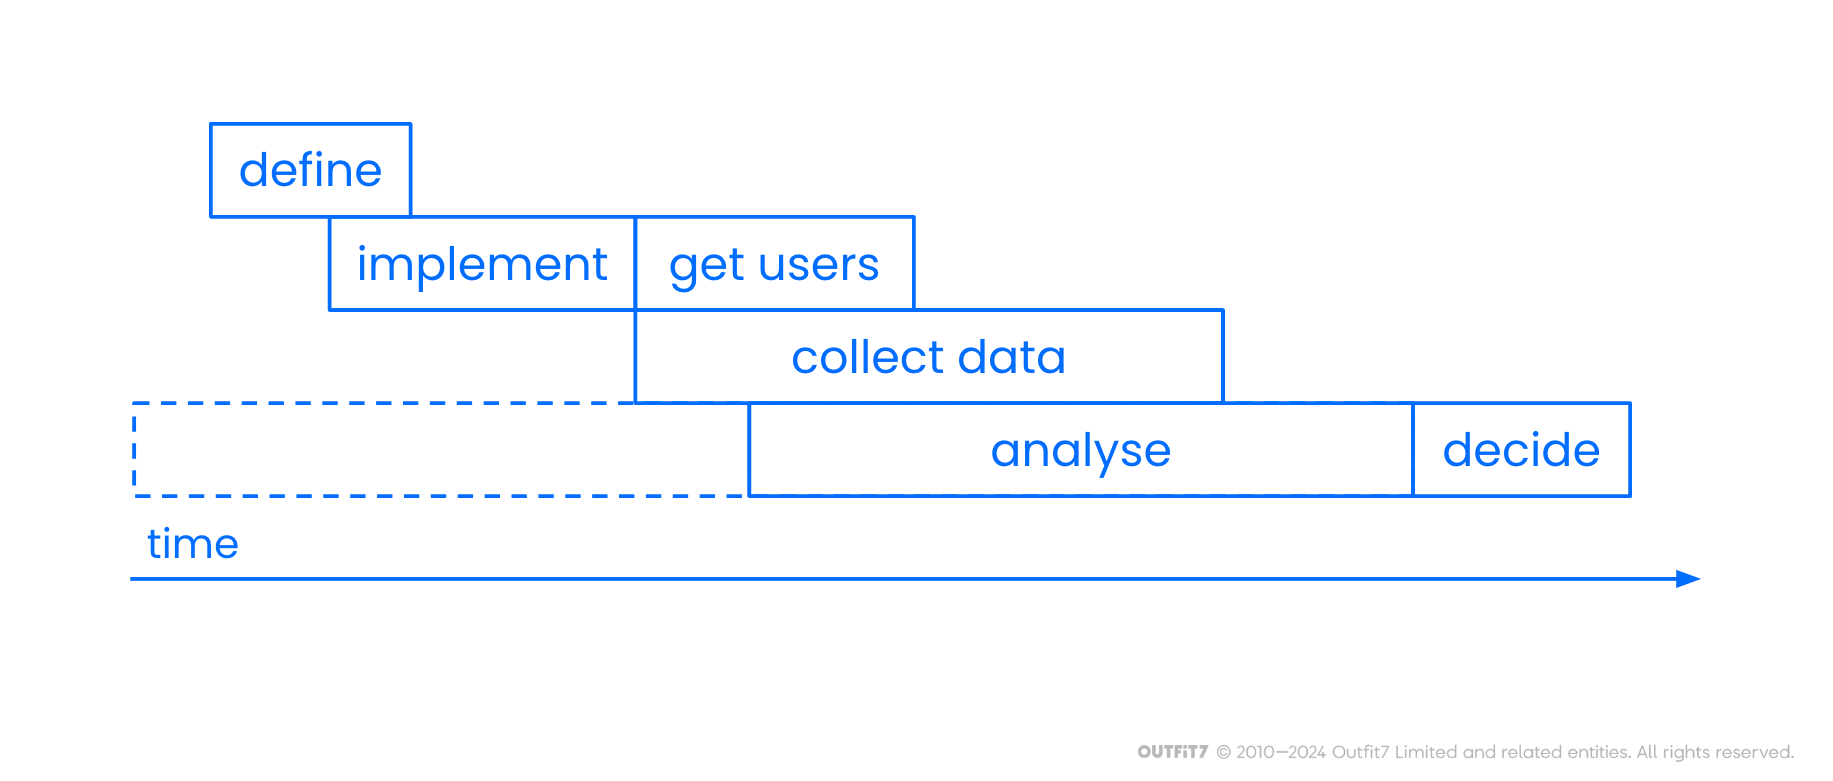
Why does it take so long? Well, the people who come up with appropriate problems or test ideas often need to sell the idea to their team first. Once this is done, the test needs to be defined. This can be done in a couple of hours if the test is simple (e.g. just a configuration change). However, if the test aims to solve a new problem or requires a big new product feature, it might require several meetings with interdisciplinary teams, pre-test data analysis, and a considerable amount of documentation (e.g. new feature specification, quality assurance test scenarios, user acquisition plan, specification of new A/B test infrastructure features, etc.). Then, the test needs to be added to the work plan and may stay on hold until each required team can execute their associated tasks (e.g. creating art, developing and testing code).
After the test is implemented, it’s time to start collecting test users and data, which can take several weeks or even months. Finally, the results of the test are analyzed and presented in order to make the final decision.
Implementing A/B tests
When it comes to implementing A/B tests, it’s helpful to communicate clear test goals to the entire team before starting to work on it. This empowers team members to contribute ideas and identify potential issues, and it decreases the likelihood of miscommunication.
Next comes quality assurance, which ensures the tested features and data collection are implemented correctly. This is crucial because without it potential issues (e.g. bugs, biases or missing data) can go unnoticed until the test data is analyzed, incurring costs along the way and rendering your results completely useless.
Additionally, it's crucial to consider how user experience will be handled after the test is completed. As mentioned above, this might be as simple as switching all test users to the winning variant or as complex as supporting all the test variants until the end of their lifetime.
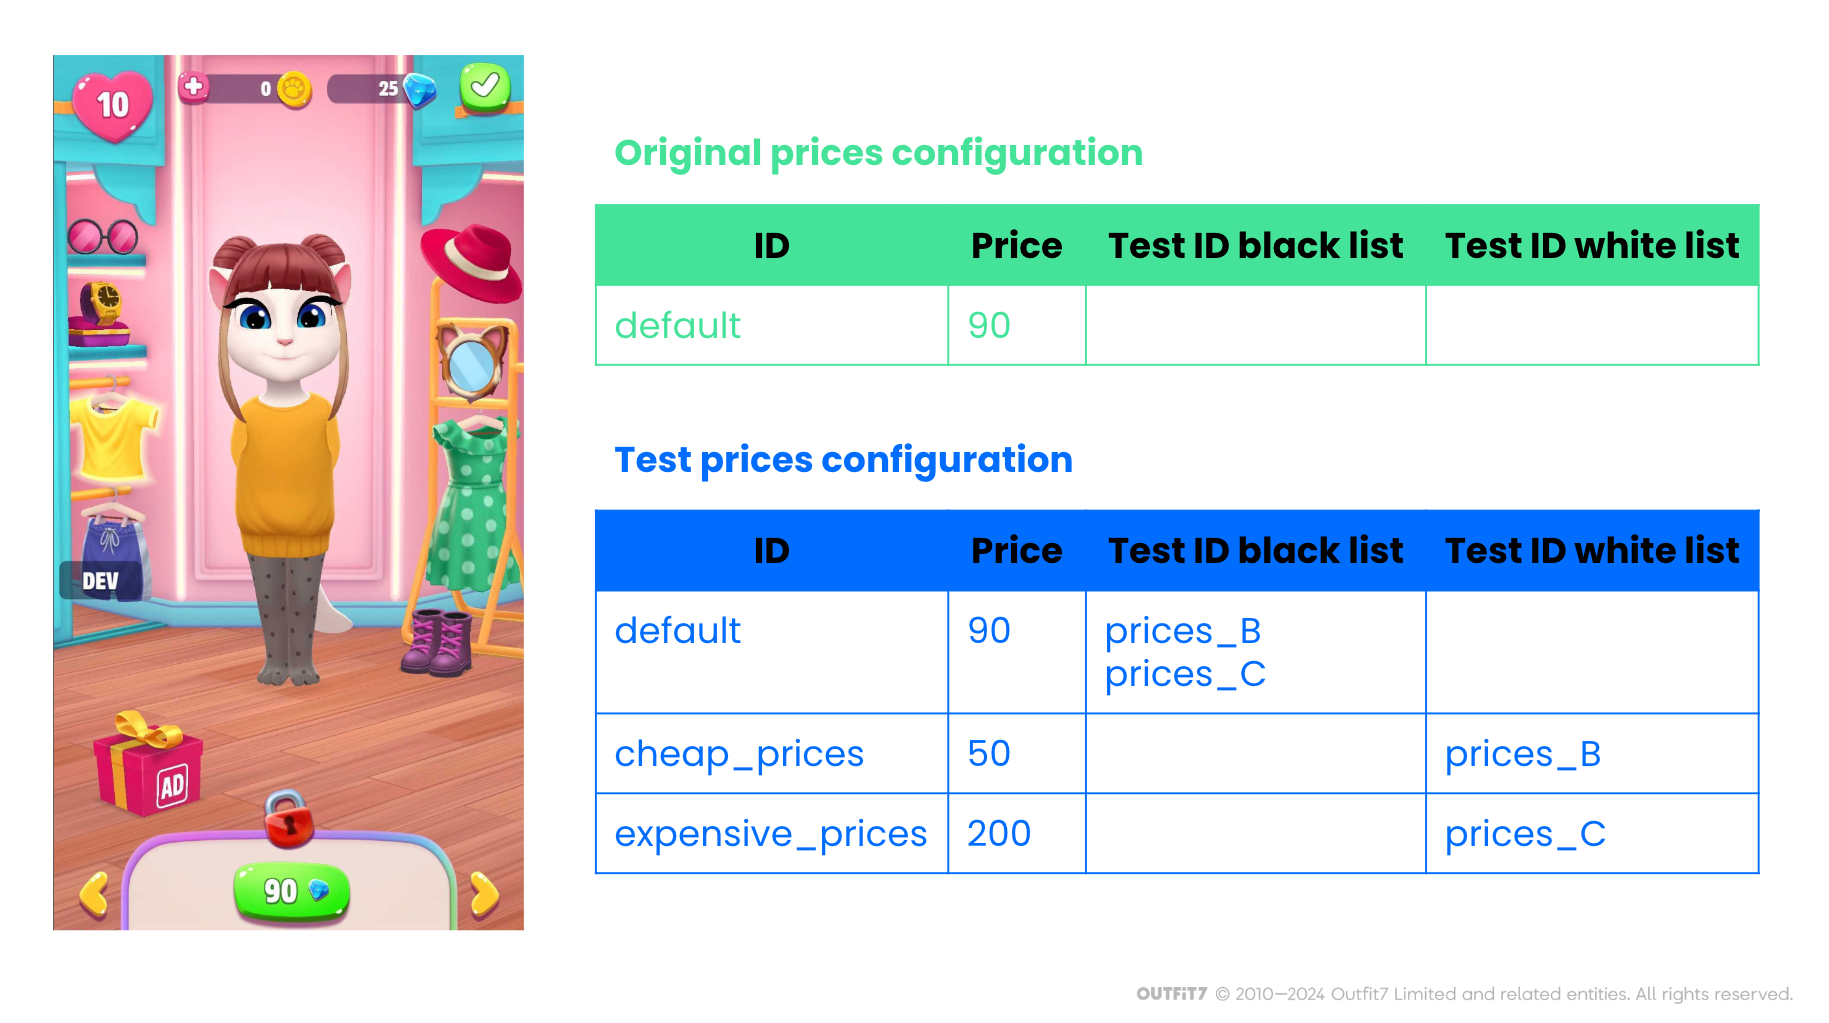
Another key component to efficient A/B testing is reliable test infrastructure. In our case, this includes game and test configuration dashboards, backend services for assigning users to test groups, and collecting, storing and aggregating the test data. This enables us to do simple A/B tests with minimal effort. For example, to test the impact of wardrobe item prices, we only need to add price configurations for the test groups (as shown in the figure below), select how many and which users (e.g. by country, application version, etc.) we need per test group, and press the “start test” button. Over the following days our A/B test dashboard refreshes automatically, clearly showing the impact of the price changes on all relevant game performance metrics using graphs, tables, and statistical results.
Collecting data
We’ve already discussed how many users are needed per test group, but it’s also important to consider the time frame in which they are added to the test and exactly how long you’ll be collecting their data for.
The amount of time it takes to collect users depends on the number of required test users, whether they need to be new or existing users, and the amount of users that can be acquired each day.
In our case, this typically takes around one to four weeks, or in some cases up to eight weeks. Even if you can acquire enough users in a single day, you may need to slow down and extend user acquisition to cover an entire seasonality period. For Outfit7, this is a one-week period, because new users who install our games during weekends have different behavior compared to those who install on a workday. Furthermore, you may want to avoid acquiring users during certain periods, such as holidays, because they can bias your sample. Although your effect will be the same on all test groups, it might differ from the effect you will have on users obtained during normal days.
Second, users must keep using the designated product variant long enough to acquire enough required data. For example, if the test group affects the initial experience and its impact on the observed metric is short-lived, it may be enough to observe the users for a week. However, if users experience the change in product only after some time (e.g. we change the difficulty of levels that can only be reached after one month of play), or if the effect of the test group changes through time (e.g. user engagement with the new feature decreases over the first three weeks after their first use), or if the observed metric has spikes spaced over long time intervals (e.g. buying a monthly battle pass), you’ll need to be collecting test data over a long period of time.
The data collected must include at least the test group id and data that enables you to compute the relevant test metrics. Additional data is often very useful. For example, data for computing your key performance indicators enables you to detect unexpected test influences; market segment data enables you to compare test effects on each market segment (e.g. country, platform, user source); and user ids enable you to analyze the impact of the test per user. In general, collecting as much data as possible (without negative impacts on user experience and with acceptable infrastructure cost) is preferable because new questions often pop up while you’re in the process of analyzing your test data.
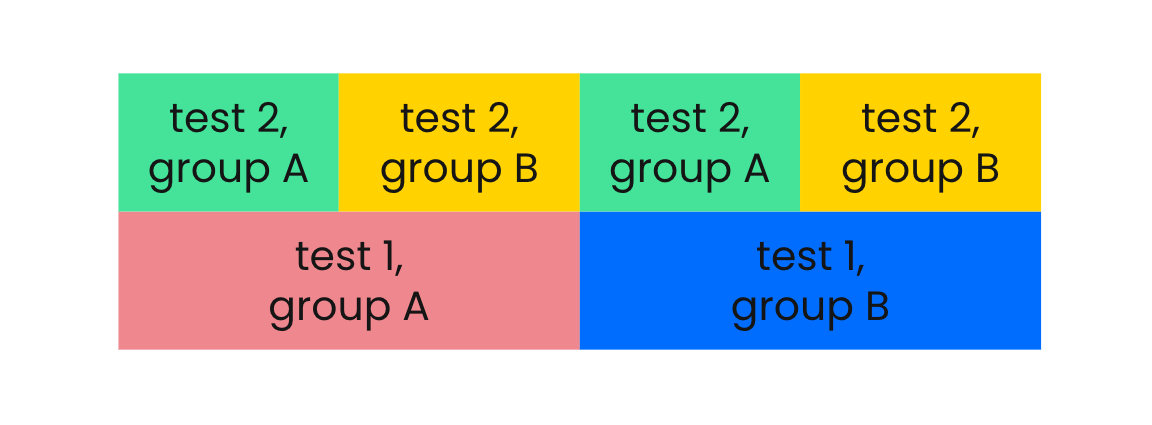
If multiple A/B tests are conducted on the same users, it’s important to prevent bias caused by the past or concurrent A/B tests. For example, if we conducted Test 1 with groups A and B, we must make sure that in Test 2, each new test group has an equal share of users from our Test 1 groups, as shown in the figure below. This can be easily achieved by adding a unique test id as a salt to the user id, computing a hash function from it, and assigning a range of hashes to each test group.
Analysis
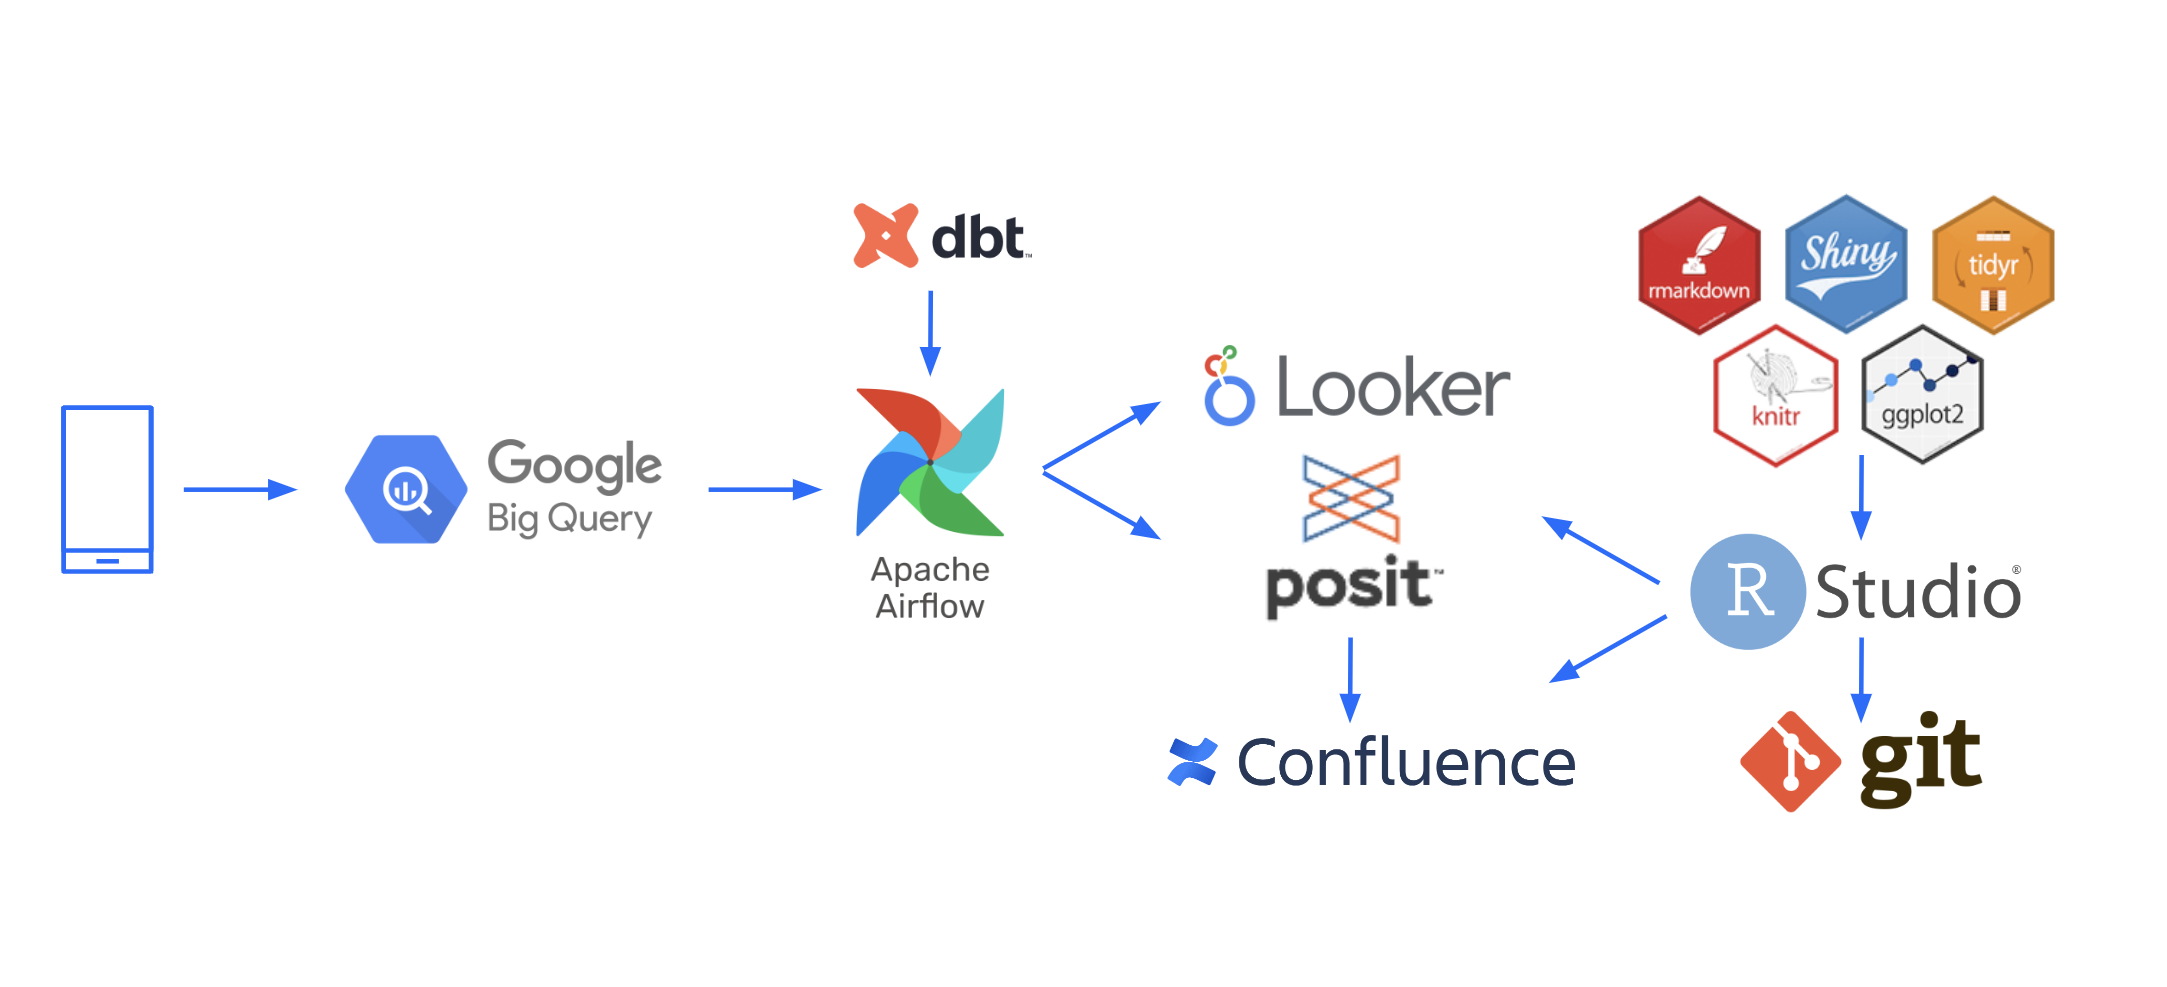
Some data analysis can be automated, while some manual data analysis can be done while the data is being collected. However, the final test results can only be calculated after all the required data is collected. The figure below shows our test data analysis pipeline.
We collect users’ data in a BigQuery data warehouse, which enables easy access to data for automated and exploratory analysis, as well as efficient, cost-effective storage and processing of large amounts of data. Then, we use the dbt data transformation tool to define how data aggregates, such as the key test metrics, are computed. It enables data analysts to use SQL in order to define the data transformations and ensure data quality, centralizes data documentation and discovery, and makes complex data processing reliable and maintainable – some aggregates are the result of more than 10 consecutive transformations of data obtained from multiple sources.
Our data transformations are run using Apache Airflow, which automatically schedules (and also retries when necessary) data transformation jobs, enables re-running selected jobs or all jobs that depend on their results (in case of bugs or when adding new aggregates for past data), and enables scalability and operability of data processing pipelines. Finally we use data processing and visualization tools to create automatic reports and share them with the team. We use Looker Studio to quickly build simple dashboards, and Posit Connect to create custom complex dashboards and reports that require access management using R code and packages, such as Shiny, ggplot2, tidyr, dplyr, purrr, rmarkdown, and knitr.
In addition to automated analysis, we also conduct custom data analysis when testing new features, or when in depth analysis is required. The analysis code is stored in git which allows for efficient code reviews, future reference, extending the analysis, and reusing the code. Test analyst interprets the data and writes a test report (which is thoroughly peer reviewed) and finally presents the report to decision-makers. We use Atlassian Confluence to publish and share test reports, which include a short executive summary with a couple of main plots, links to test specification and configurations, over 60 standard plots exported from the A/B test dashboard and additional custom plots and tables – everything neatly organized as a single source of truth.
Decision making
After a test report is peer reviewed, the relevant decision can finally be made based on the results. In some cases, this may be as simple as a five minute presentation to the decision-makers who all agree to a simple outcome (e.g. “We all agree with the proposed decision to switch all users to the winning group.”). On the other hand, the results may lead to further questions and the need for additional data or analysis. Sometimes, the broader consequences of switching to the new variant are unclear or cannot be measured. In these cases, the decision will be more complex, taking into account the knowledge and experience of the team, as well as the broader business position. Sometimes you will even arrive at the outcome that you need to return to one of the previous A/B test steps to gain more insight and arrive at a better or safer decision.
Conclusion
A/B testing can either be a scientifically correct and highly effective tool for optimizing products or it can be a big waste of time and money. The outcomes depend mainly on the people and the process of execution. I hope that this blog post inspires you to conduct your own A/B tests, and that the insights shared help you get the most value possible out of them.